Global – October 27, 2026 -- The right OPC UA collection rate is the slowest configuration that still preserves the process behavior needed for operations and historical analysis, and it is set across five separate stages rather than one "scan rate." Device updates, server sampling, subscription publishing, filtering and historian storage each have their own timing. Treating them as one setting can add load without adding information, or hide a pressure transient the historian was expected to explain.
Server sampling cannot beat the source update rate
A PLC may update a temperature every 500 milliseconds while the OPC UA server refreshes its internal value once per second. A client request to sample every 100 milliseconds then re-reads the same value or detects changes no sooner than the server exposes them.
The monitored-item sampling interval is a best-effort cyclic rate, and a request of zero means the fastest practical rate, not a guaranteed one. Servers often support a limited set of intervals and can return a revised sampling interval, which the client should treat as the actual agreement. The server can also revise the requested publishing interval.
Publishing intervals cut latency but do not speed up the source
The publishing interval belongs to the subscription, which sends queued notifications at each cycle. Sampling can occur several times within one publishing interval, and queue size and other subscription limits shape how those notifications are grouped. A shorter publishing interval can reduce delivery latency, but the source does not update faster as a result.
Deadbands discard small numeric changes before the historian sees them
An OPC UA DataChangeFilter suppresses small numeric changes before notification, so the historian cannot reconstruct suppressed samples. OPC UA defines three deadband types: None, Absolute and Percent. Absolute reports a change greater than a configured value in the measurement's units. Percent sets the threshold as a share of the item's EURange.
A 1 percent deadband on an EURange of 0 to 200 bar produces a 2 bar threshold, not 1 percent of the current reading. If EURange is missing or does not match the intended operating range, the percentage setting is unavailable or may produce an unsuitable threshold. Deadbands apply to numeric variables, so a Boolean motor-running state has no useful noise band, and status changes are not suppressed merely because a value falls within a deadband.
Evidence requirements, not tag counts, should set the intervals
A temperature used for long-term energy analysis may tolerate slower collection than the same temperature used for trip investigation. A pressure average can look correct even when a damaging one-second excursion was never collected. Teams should define the shortest event duration, the maximum acceptable detection delay, the smallest meaningful value change and the calculations that will use the data.
Short sampling intervals, tight deadbands and short publishing intervals raise load on server CPU, subscription queues, network traffic, collector processing and historian writes across thousands of points. Aggressive upstream filtering trades data volume for irreversible information loss and fits only where noise is understood and the suppressed changes are demonstrably irrelevant.
Controlled tests should compare collected history with a high-resolution reference
The recommended test captures a trusted reference from the controller, server or test instrument and records requested and revised sampling and publishing settings, plus filter and queue settings. Operators then generate known ramps, small oscillations, fast transients and state transitions where the process permits. Event timing, peaks, transition counts, averages and totals in the collected history are compared with the reference, while server, network, collector and storage load are observed before the configuration is expanded. The test should be repeated after firmware, server or collector changes.
TDengine's OPC UA ingestion offers subscribe and observe modes
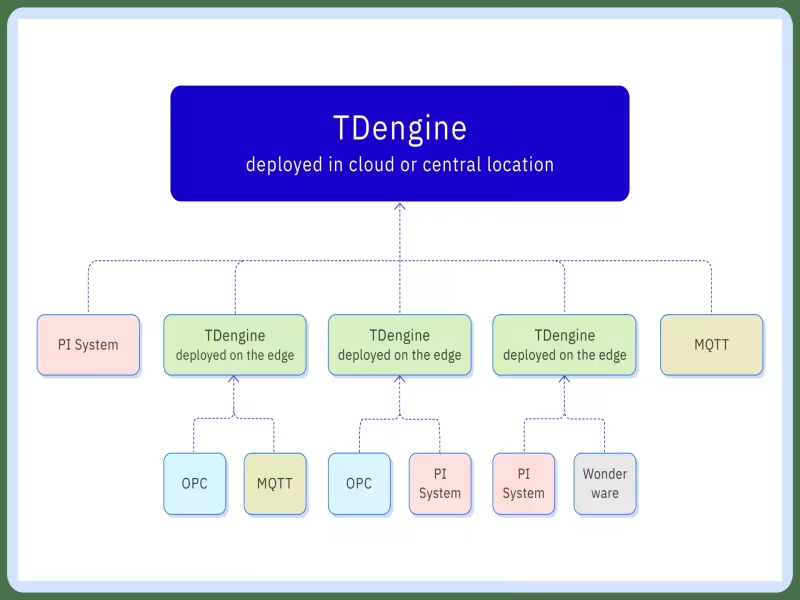
TDengine TSDB-Enterprise OPC UA ingestion supports subscribe mode, in which the server reports data changes, and observe mode, in which the task polls at a configured collection interval. The documentation states that the observe interval is task-level and that subscribe mode does not scan every point on a fixed interval. It does not describe a taosExplorer control for monitored-item sampling intervals, publishing intervals or deadbands, so those settings must be verified in the OPC UA server and the connector version in use.
Retention, downsampling and query design in a time-series database cannot restore a transient that source sampling or a deadband never reported.